
World Cup 2026 in Canada: What changes from the city to the stadium?
For Canada, the World Cup 2026 connectivity story is not about scale across many cities. It is about precision.
Toronto and Vancouver will carry the country’s host-city experience, each with a different urban profile, a different stadium environment and a different role in the tournament calendar. Toronto will stage Canada’s first match and six games in total at BMO Field. Vancouver will host seven matches at BC Place, including knockout-stage fixtures.
That makes Canada a particularly interesting case for mobile Quality of Experience. With only two host cities, the analysis can move beyond broad averages and focus on a sharper question: how much does the fan experience change when moving from the city baseline to the stadium surroundings?
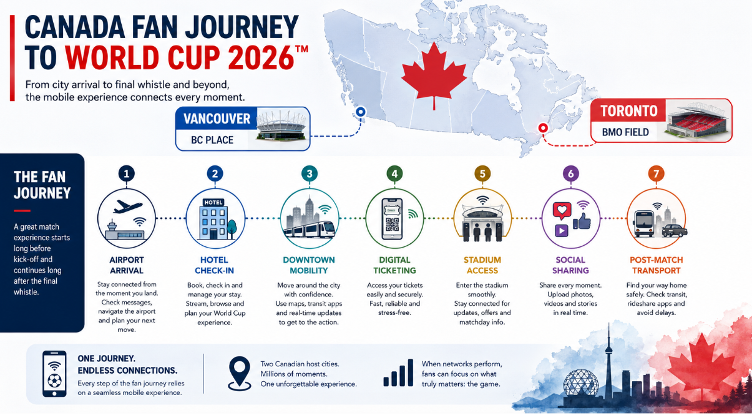
During the tournament, fans will depend on mobile networks for almost every step of the matchday journey: opening digital tickets, checking routes, coordinating with friends, sharing videos, loading social media, streaming highlights and navigating crowded areas before and after each game.
In that context, connectivity is no longer a background utility. It becomes part of the fan experience itself.
But good city-level performance does not automatically guarantee the same experience around the venue. Stadium areas concentrate movement, attention and digital demand. They are where fans gather, upload, stream, search, refresh and reconnect — often at exactly the same moments.
That is why this MedUX analysis looks at Canada’s World Cup 2026 mobile experience through two layers: the host-city baseline across Toronto and Vancouver, and the stadium-area reality around BMO Field and BC Place.
The goal is not to create a simplistic ranking between cities or operators. It is to identify where the experience is consistent, where it changes, and which KPIs matter most for real fan journeys: Download speed, Upload speed, 5G access, latency, DNS lookup, social media loading and streaming start time.
This is not a live matchday stress test. The decisive moments will come with arrival peaks, halftime traffic, goals, final whistle and post-match mobility. But the baseline already helps answer a key question for Canada’s World Cup readiness: will the mobile experience hold where fans need it most?
Host-city baseline: two different digital profiles
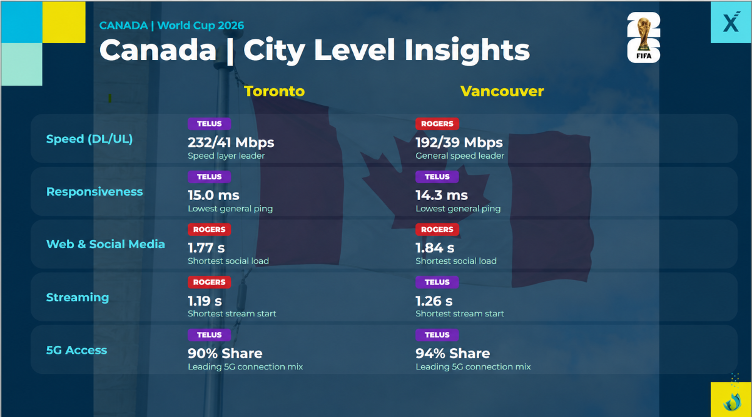
At city level, Canada’s two host cities show a highly competitive baseline, but with different strengths. Toronto appears slightly stronger in responsiveness, web browsing, streaming start and general speed, while Vancouver stands out for 5G access intensity. The result is not a uniform connectivity story, but rather two complementary digital profiles that should be monitored closely as tournament demand increases.
Toronto profile
Toronto shows the most balanced baseline across several fan-relevant indicators. It records the lowest web DNS lookup time among the two Canadian host cities, at around 32.3 ms, compared with Vancouver at around 34.7 ms. The same pattern appears in general responsiveness, where Toronto shows the lowest average ping, at around 20.0 ms, slightly ahead of Vancouver. In gaming-related responsiveness, Toronto also performs marginally better, with average gaming ping of around 27.6 ms. Toronto also shows the shortest streaming start time, at around 1.49 seconds, and the shortest social media fully loaded time, at around 2.01 seconds. In speed, Toronto records the highest average Download speed and Upload speed among the two cities, at around 129.7 Mbps and 32.0 Mbps, respectively. On 5G, Toronto reaches average 5G Download speed of around 154.9 Mbps and average 5G Upload speed of around 34.9 Mbps, with an observed 5G active-connection share of around 82.3%.
At operator level, Toronto shows a split between speed, responsiveness and application-loading performance. Telus leads the speed layer, with average Download speed of around 231.9 Mbps, average Upload speed of around 41.1 Mbps, average 5G Download speed of around 252.6 Mbps, and average 5G Upload speed of around 44.2 Mbps. Telus also records the lowest general ping, at around 15.0 ms, and the shortest streaming start time, at around 1.19 seconds, although its gaming ping and web/social media loading indicators are less favorable than the leading operator profiles. Bell also performs strongly in speed, with average Download speed of around 204.2 Mbps, average Upload speed of around 37.4 Mbps, and average 5G Download speed of around 241.0 Mbps. Bell also shows the shortest web fully loaded time, at around 1.25 seconds, and a short streaming start time, at around 1.21 seconds. Rogers, meanwhile, stands out in responsiveness and social media loading, with the lowest web DNS lookup time, at around 31.0 ms, gaming ping of around 20.5 ms, and the shortest social media fully loaded time, at around 1.77 seconds. Rogers also records solid speed indicators, with average Download and Upload speed of around 172.5 Mbps and 38.2 Mbps, respectively.
Vancouver profile
Vancouver has a different profile. Its strongest signal is 5G access intensity: the city records the highest observed 5G active-connection share among the two Canadian host cities, at around 91.4%, clearly ahead of Toronto. That suggests a very strong access-technology baseline, particularly relevant for dense fan environments where users expect mobile video, navigation, messaging and app-based services to remain available under pressure. Vancouver also shows strong 5G speed, with average 5G Download speed of around 151.8 Mbps and average 5G Upload speed of around 30.4 Mbps. However, Toronto keeps a slight advantage in several responsiveness and service-loading indicators. Vancouver records web DNS lookup time of around 34.7 ms, average general ping of around 20.8 ms, gaming ping of around 27.9 ms, streaming start time of around 1.60 seconds, and social media fully loaded time of around 2.09 seconds. These are not major gaps, but they suggest that Vancouver’s watch area is not 5G access itself; it is the conversion of that strong 5G presence into consistently faster application response and loading.
At operator level, Vancouver shows a clear split between responsiveness, speed and service loading. Telus leads several latency-sensitive indicators, with the lowest general ping, at around 14.3 ms, the lowest gaming ping, at around 16.3 ms, and the shortest streaming start time, at around 1.26 seconds. Telus also records the highest average 5G Download speed in the city, at around 229.1 Mbps, although its web fully loaded time, at around 2.16 seconds, is less favorable than Rogers and Bell. Rogers leads the general speed layer, with average Download speed of around 192.3 Mbps and average Upload speed of around 38.7 Mbps. Rogers also shows the strongest 5G Upload speed, at around 40.7 Mbps, and the best application-loading indicators for web and social media, with web fully loaded time of around 1.45 seconds and social media fully loaded time of around 1.84 seconds. Bell stands out in web DNS lookup time, at around 23.4 ms, and social media TTFB, at around 424.5 ms, while also recording average 5G Download speed of around 217.0 Mbps. However, Bell appears more challenged in general Download and Upload speed, at around 106.4 Mbps and 28.8 Mbps, respectively, as well as in streaming start time and social media fully loaded time.
The takeaway is simple: Canada’s World Cup connectivity story is highly competitive, but not uniform. Toronto looks more responsive- and speed-led at city level, but the operator view shows that Telus and Bell are driving much of the speed and streaming strength, while Rogers stands out in web responsiveness and social media loading. Vancouver looks more access-led, with a very strong 5G active-connection baseline, but the operator view shows a more segmented picture: Telus leads latency-sensitive and 5G Download indicators, Rogers leads general speed and application loading, and Bell performs strongly in DNS lookup but is more challenged in general speed and some service-loading indicators. No single network dimension explains the full fan experience.
The venue-area reality: why stadium measurement changes the story
A host-city baseline is useful, but it does not tell the full matchday story.
The stadium area is more specific, more concentrated and more operationally demanding. It includes the venue surroundings, access points, queues, nearby streets, transport hubs, fan gathering areas and post-match movement corridors.
That is where thousands of devices, users and expectations converge.
That is why comparing each host city with its associated stadium area is one of the most useful parts of the analysis. It shows whether the venue follows the same pattern as the city, whether it improves in certain dimensions, or whether it introduces new watch areas.
Methodological note: For this analysis, MedUX considered the area immediately surrounding each World Cup venue, with an approximate reference radius of around 600 meters from the stadium. This helps reflect the real matchday environment: access points, nearby streets, queues, transport connections, fan gathering areas and post-match mobility corridors where mobile demand is expected to concentrate.
In Canada, the two city-to-stadium comparisons tell two different stories.
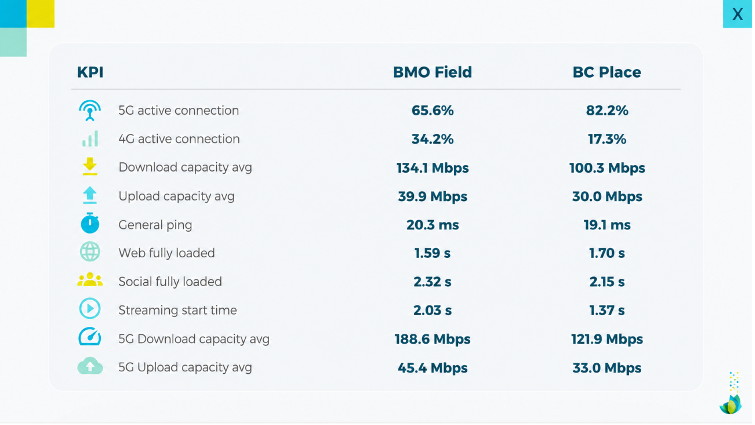
Toronto - BMO Field: stronger speed signals, but social and video need monitoring
Toronto and BMO Field show a nuanced city-to-stadium transition.
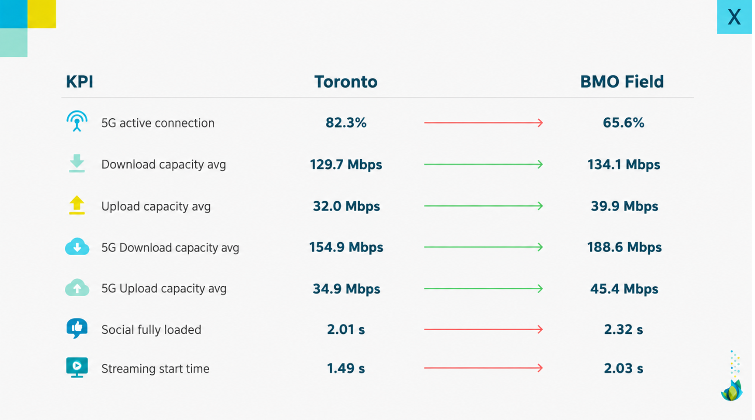
The stadium area has a lower observed 5G active-connection share than the broader Toronto baseline: 65.6% around BMO Field versus 82.3% at city level. That means the venue area appears more 4G-dependent than the city baseline.
However, speed indicators move in a positive direction.
Average Download speed increases slightly from 129.7 Mbps in Toronto to 134.1 Mbps around BMO Field. Average Upload speed improves more visibly, from 32.0 Mbps to 39.9 Mbps. The 5G speed indicators also improve: 5G Download speed rises from 154.9 Mbps to 188.6 Mbps, while 5G Upload speed increases from 34.9 Mbps to 45.4 Mbps.
For fans, the Upload speed signal is especially relevant. BMO Field appears well positioned for the “fan as broadcaster” use case: videos, photos, stories, live reactions and media messages.
But the picture is not entirely positive. Social media fully loaded time increases from 2.01 seconds in Toronto to 2.32 seconds around BMO Field. Streaming start time also rises from 1.49 seconds to 2.03 seconds.
That suggests a clear venue-area watch point: BMO Field shows stronger speed, especially upload, but social and video start experience should be monitored carefully under matchday pressure.
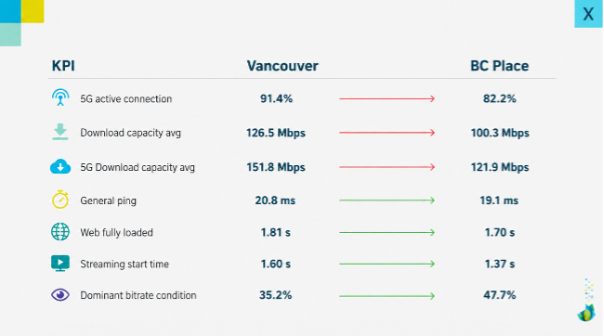
Vancouver - BC Place: better video and responsiveness, but lower Download speed
Vancouver and BC Place show a different pattern.
Like BMO Field, BC Place shows a lower observed 5G active-connection share than its city baseline: 82.2% around the stadium area compared with 91.4% in Vancouver. The venue area remains strongly 5G-oriented, but the share is lower than the broader city baseline.
Download speed also decreases around the stadium area. Average Download speed moves from 126.5 Mbps in Vancouver to 100.3 Mbps around BC Place. 5G Download speed also decreases, from 151.8 Mbps to 121.9 Mbps.
However, several experience-perception indicators improve.
General ping decreases from 20.8 ms in Vancouver to 19.1 ms around BC Place. Web fully loaded time improves from 1.81 seconds to 1.70 seconds. Streaming start time improves from 1.60 seconds to 1.37 seconds. The dominant bitrate condition also increases from 35.2% to 47.7%.
This makes BC Place a very interesting case: the stadium area appears less strong in Download speed, but stronger in the kind of immediacy and video experience that fans actually feel.
For the fan journey, that matters. Faster video start, lower latency and better bitrate conditions can make the venue-area experience feel smoother even if average Download speed is lower than the city baseline.
Comparing Canada’s stadium areas: two strong but different fan experience profiles
When looking only at Canada’s two stadium areas, the difference is not about one being “ready” and the other “not ready”.
Both show strong baselines, but they are strong in different ways.
BMO Field shows a stronger Upload speed profile. Average Upload speed reaches 39.9 Mbps, compared with 30.0 Mbps around BC Place. It also shows stronger 5G speed indicators, including higher 5G Download speed and 5G Upload speed. This profile is especially relevant for fan-generated content.
BC Place shows a stronger video and responsiveness profile. It has lower general ping, shorter streaming start time and a higher dominant bitrate condition. It also shows a higher observed 5G active-connection share than BMO Field: 82.2% versus 65.6%.
In simple terms:
- BMO Field looks stronger for upload-driven fan sharing and 5G speed.
- BC Place looks stronger for immediacy, video start and observed 5G access.
Key takeaways for operators, cities and event stakeholders
Canada’s World Cup 2026 stadium connectivity story is positive, but not uniform. It is not only about whether 5G is present. It is about whether the full digital fan journey can remain reliable when demand concentrates.
Five insights stand out.
- Both Canadian host cities show strong mobile baselines, but with different strengths.
Vancouver shows a more 5G-oriented observed technology mix, while Toronto appears slightly stronger in several experience-perception indicators such as browsing, social, streaming start time and Upload speed. - Stadium areas do not simply mirror their host cities.
BMO Field shows lower 5G active-connection share than Toronto, but stronger Download and Upload speed. BC Place shows lower Download speed than Vancouver, but better latency and video indicators. - BMO Field is particularly strong for upload-driven fan experience.
Its Upload speed and 5G Upload speed are higher than Toronto’s city baseline and higher than BC Place’s stadium-area baseline. That is relevant for fans sharing videos, photos and social content. - BC Place stands out in video and responsiveness.
Its streaming start time, general ping and dominant bitrate condition improve versus Vancouver’s city baseline, which can support a smoother fan experience around highlights and short-form video. - 5G access alone does not explain the full fan experience.
Vancouver and BC Place show stronger observed 5G active-connection shares, but BMO Field shows stronger speed indicators. This reinforces the need to measure service-level QoE, not just technology availability.
What should be monitored during the tournament?
This analysis provides a baseline, but the real test will happen during matchday peaks: before kick-off, when fans arrive and open digital tickets; during queues and access control; at halftime; after goals and key moments; immediately after the final whistle; and across post-match transport corridors, fan zones and nearby entertainment districts.
For Canada, the priority should be to monitor the full matchday experience around each venue, focusing on the indicators that most directly affect the fan journey: observed 4G/5G active-connection mix, Download and Upload speed, 5G speed, latency and jitter, social media loading, streaming start time, bitrate condition, web browsing and DNS lookup.
The baseline already shows why this granular view matters. BMO Field presents stronger speed signals, especially in upload and 5G speed, but social and video start indicators should be monitored. BC Place shows stronger video and responsiveness indicators, even though Download speed is lower than Vancouver’s city baseline.
The lesson is simple: city averages are useful, but the fan experience will be decided closer to the venue. The real question is not whether networks look ready on paper, but whether Toronto, Vancouver and their stadium areas can deliver a consistent digital experience when the world arrives.
Final thoughts
The FIFA World Cup 2026™ will put Toronto and Vancouver under global digital visibility.
At city level, both show strong mobile experience baselines. Vancouver has the more 5G-oriented observed access mix, while Toronto performs slightly better across several user-perceived experience indicators.
At stadium-area level, the picture becomes more specific.
BMO Field shows stronger Upload speed and 5G speed signals, but social and streaming start indicators should be monitored. BC Place shows stronger video and responsiveness indicators, even though Download speed is lower than Vancouver’s city baseline.
The lesson is simple: strong city performance does not remove the need for venue-area measurement.
The real question is not whether Canada’s host cities look ready on paper.
It is whether Toronto, Vancouver and their stadium areas can deliver a consistent digital fan experience when the world arrives.
Want to understand how mobile experience changes from city level to stadium areas?
MedUX helps operators, regulators and public stakeholders measure real Quality of Experience across mobile networks, high-density areas and critical event locations — combining crowdsourced visibility, active testing and advanced QoE analytics.
Contact us to learn how MedUX can support World Cup readiness, event-area monitoring and network experience benchmarking.
Don’t forget to follow us on social media and subscribe to our newsletter to receive the latest updates and news.
Follow us on:


About MedUX
MedUX is a global leader in Quality of Experience testing and monitoring, helping telecom operators, regulators, governments and digital enterprises understand how users actually experience fixed, mobile and Wi-Fi networks.
Through a multi-platform measurement ecosystem — including mobile and fixed probes, apps, SDKs, crowdsourcing and advanced analytics — MedUX provides end-to-end visibility into network and service performance, supporting benchmarking, optimization, regulatory compliance and customer experience improvement across markets worldwide.
Explore the Latest from MedUX
Honduras Mobile Network Experience in Q1 2026: Performance and QoE by Operator
Honduras’ mobile experience in Q1 2026 reflects a market where competitive leadership depends strongly on the service being measured. Claro shows clear strength in speed, application loading and streaming startup, while Tigo stands out in latency-sensitive and responsiveness indicators.
…

Dominican Republic’s Mobile Network Experience in Q1 2026: 5G, Performance and QoE by Operator
Dominican Republic’s mobile experience in Q1 2026 reflects a market where network leadership depends strongly on the dimension being measured. Claro shows clear strength in speed and several service-level indicators, Altice stands out in general network responsiveness and upload performance,…

MedUX Presents its QoS and QoE Measurement Project with ARTCI at ITU Zambia
Objective measurement of Quality of Service and Quality of Experience is becoming a key tool for regulators seeking to improve connectivity, transparency, and network performance.
MedUX participated in the ITU Workshop on Telecommunication Quality of Service, Quality of Experience and…