
World Cup 2026 in Mexico: What changes from the city to the stadium?

The FIFA World Cup 2026™ will be more than a global football tournament. It will be a massive social, economic and digital event, bringing millions of fans, visitors and online audiences into a highly connected experience across North America. For host countries and cities, the tournament will create extraordinary visibility, tourism activity, mobility demand and pressure on public and private infrastructure. In this context, connectivity becomes part of the event experience itself: fans will depend on mobile networks to access tickets, navigate cities, coordinate with others, share content, stream highlights and stay informed in real time.
The FIFA World Cup 2026™ will not be experienced as a national average.
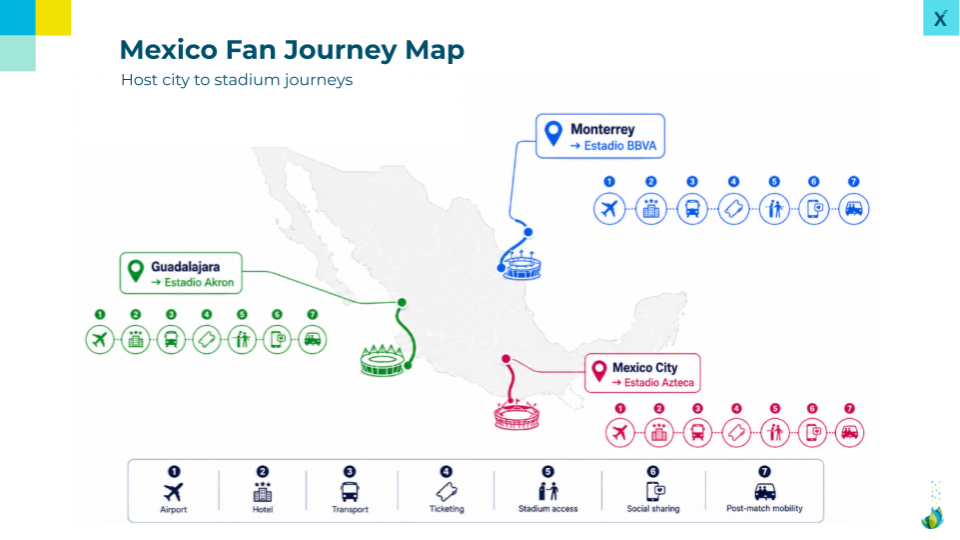
It will be experienced in very specific places: airports, hotels, city streets, public transport routes, fan zones and, above all, stadium surroundings.
In Mexico, that means three host cities with very different digital profiles: Mexico City, Guadalajara and Monterrey. Each will play a role in one of the most connected sporting events ever staged. Mexico City will carry an especially symbolic weight, with FIFA confirming that the opening fixture of the tournament will take place at Mexico City Stadium on Thursday, 11 June 2026. FIFA also lists Mexico City, Guadalajara and Monterrey among the official host cities for the tournament.
But for fans, the question is not whether a city has good mobile networks on paper.
The real question is much more practical:
- Can they open their digital ticket at the gate?
- Can they find the right transport route after the final whistle?
- Can they upload a video from the stadium surroundings?
- Can social media load when thousands of fans are posting at the same time?
- Can highlights start quickly while people move across the city?
That is where Quality of Experience becomes the real measure of World Cup readiness.
In this article, MedUX looks at Mexico’s World Cup 2026 mobile experience through two connected layers:
First, the host-city baseline across Mexico City, Guadalajara and Monterrey.
Second, the stadium-area reality around Estadio Azteca, Estadio Akron and Estadio BBVA.
The goal is not to create a simplistic ranking. It is to understand how the fan experience may change when moving from the broader city environment to the specific venue areas where digital demand will concentrate.
This is a baseline analysis, not a live matchday stress test. The real test will come during arrival peaks, halftime, goals, final whistle and post-match mobility. But the baseline already reveals something important: the stadium area does not always behave like the city around it.
Host-city baseline: three different digital profiles
At city level, Mexico’s three host cities show different strengths.
Monterrey profile
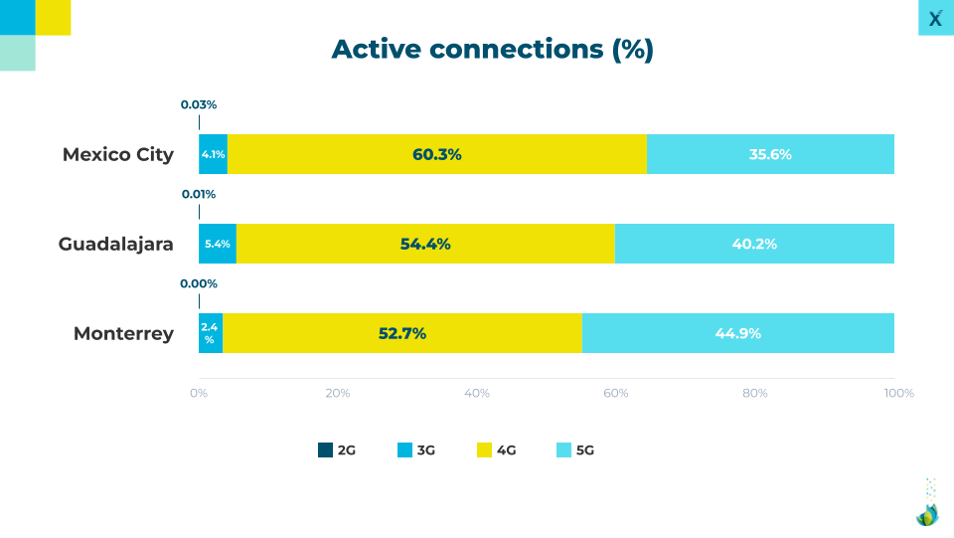
Monterrey shows the most consistent baseline across several fan-relevant indicators. It has the highest observed 5G active-connection share among the three cities, at around 44.9%, followed by Guadalajara at 40.2% and Mexico City at 35.6%. It also records the lowest web DNS lookup time, at around 32.7 ms. The same pattern appears in general responsiveness, where Monterrey shows the lowest average ping at around 50.0 ms, ahead of Mexico City and Guadalajara. Monterrey also shows the shortest social media fully loaded time, at around 2.86 seconds, and the highest average Download speed and Upload speed, at around 49.7 Mbps and 10.6 Mbps, respectively.
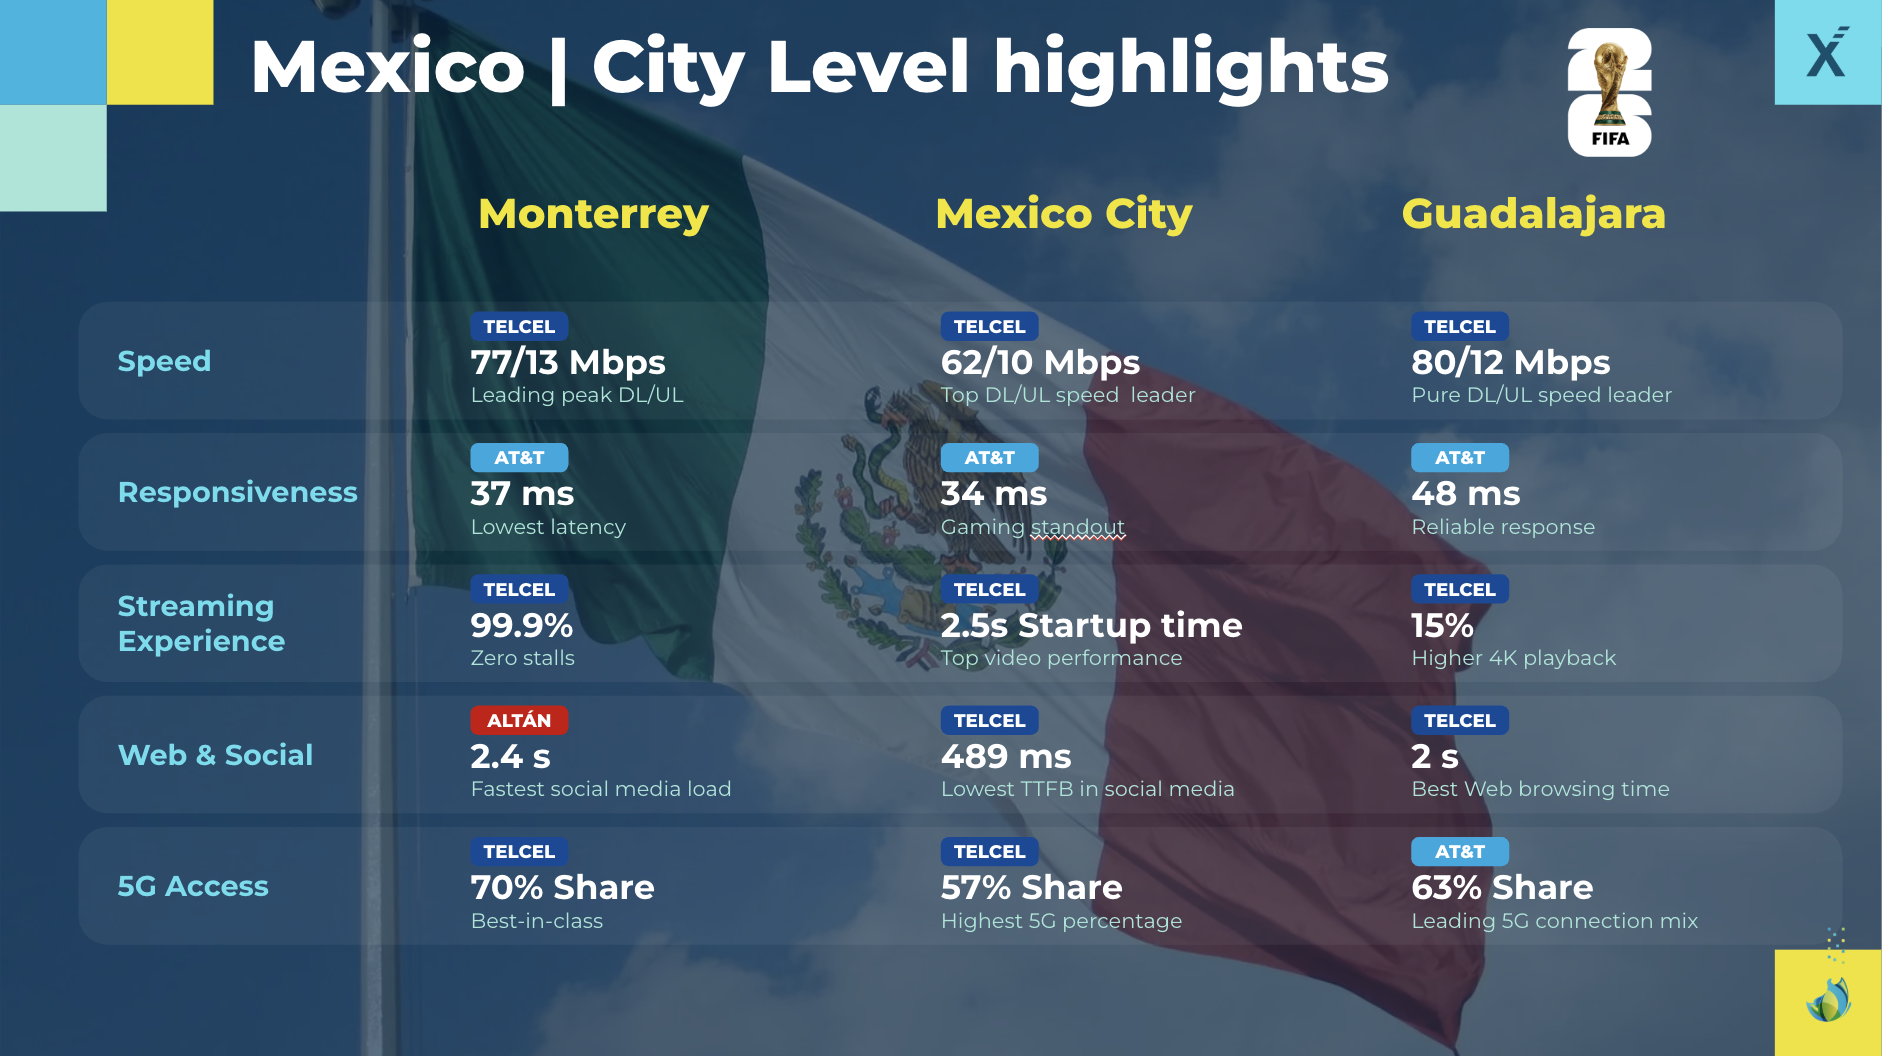
At operator level, Monterrey’s profile is particularly interesting. Telcel shows the strongest capacity indicators, with average Download speed of around 76.6 Mbps, average Upload speed of 12.8 Mbps, and the highest observed 5G active-connection share in the city, at around 69.7%. Telcel also records average 5G Download speed of around 196.2 Mbps. AT&T, meanwhile, stands out in responsiveness, with the lowest general ping at around 36.9 ms and the lowest gaming-related ping at around 38.4 ms, as well as the lowest web DNS lookup time at around 25.4 ms. Altán shows strong application-loading signals, with the shortest social media fully loaded time, around 2.39 seconds, although its observed active-connection mix remains almost entirely 4G in this dataset. Movistar appears more challenged in latency-sensitive indicators, with higher general and gaming ping values than the other operators.
Mexico City profile
Mexico City has a different profile. It shows the shortest streaming start time among the three host cities, at around 2.63 seconds. Mexico City also records the lowest gaming-related ping, at around 56.5 ms, compared with Monterrey and Guadalajara. That matters because Mexico City will be one of the most visible digital environments of the tournament, especially with the opening match, where video start, app responsiveness and real-time fan interactions will be especially relevant.
The operator-level view helps explain that profile. Telcel shows the strongest overall capacity indicators in Mexico City, with average Download speed of around 62.2 Mbps, average Upload speed of 10.6 Mbps, and the highest observed 5G active-connection share, at around 57.5%. Telcel also records average 5G Download speed of around 118.8 Mbps and the shortest streaming start time among the main operators, at around 2.52 seconds. AT&T stands out in latency-sensitive indicators, with the lowest gaming-related ping at around 35.5 ms, the lowest general ping at around 53.0 ms, and the lowest web DNS lookup time at around 33.1 ms. Altán remains heavily 4G-based, with around 99.5% observed 4G active connections, while Movistar shows comparatively higher latency and social media TTFB, making responsiveness a more visible watch area.
Guadalajara profile
Guadalajara remains competitive in several capacity indicators, particularly in 5G Download speed. Guadalajara records average 5G Download speed of around 114.5 Mbps, ahead of Mexico City, although below Monterrey. However, Guadalajara’s DNS lookup time, at around 65.2 ms, its general ping, at around 62.2 ms, and its social media fully loaded time, at around 3.16 seconds, suggest that responsiveness and app loading should be monitored more closely as the analysis moves from city baseline to stadium-area experience.
At operator level, Guadalajara shows a split between access, capacity and responsiveness. Telcel leads the capacity layer, with average Download speed of around 80.3 Mbps, average Upload speed of 12.2 Mbps, and average 5G Download speed of around 201.3 Mbps. AT&T shows the highest observed 5G active-connection share in the city, at around 63.2%, and also performs strongly in responsiveness, with the lowest general ping at around 48.3 ms and the lowest web DNS lookup time at around 22.7 ms. Movistar shows a relevant observed 5G share, around 53.1%, but its latency and social media loading indicators are less favorable than the leading operator profiles. Altán is again mostly 4G-based in the dataset, with very limited observed 5G active connections.
The takeaway is simple: Mexico’s World Cup connectivity story is not uniform. Each host city brings a different mix of speed, responsiveness, 5G access and service-level experience — and the operator-level view shows that no single network dimension explains the full fan experience. In Monterrey, speed and responsiveness are split across different operator strengths. In Mexico City, Telcel drives speed while AT&T stands out in latency. In Guadalajara, Telcel leads speed, while AT&T shows stronger observed 5G access and responsiveness.
The venue-area reality: why stadium measurement changes the story
A host-city baseline is useful, but it does not tell the full matchday story.
The stadium area is a much more specific environment. It concentrates fans, devices, traffic and expectations in a limited space and within short time windows. It also includes streets around the venue, access points, queues, nearby transport routes, fan gathering areas and post-match movement corridors.
That is why the comparison between each city and its associated stadium area is so valuable.
It shows whether the venue area follows the same pattern as the city, whether it performs better in certain dimensions, or whether it introduces new watch areas.
In Mexico, the three city-to-stadium comparisons tell three different stories.
Methodological note:For this analysis, MedUX considered the area immediately surrounding each World Cup venue, with an approximate reference radius of around 600 meters from the stadium. This helps reflect the real matchday environment: access points, nearby streets, queues, transport connections, fan gathering areas and post-match mobility corridors where mobile demand is expected to concentrate.
Mexico City - Estadio Azteca: broadly aligned, but social, upload and video need attention
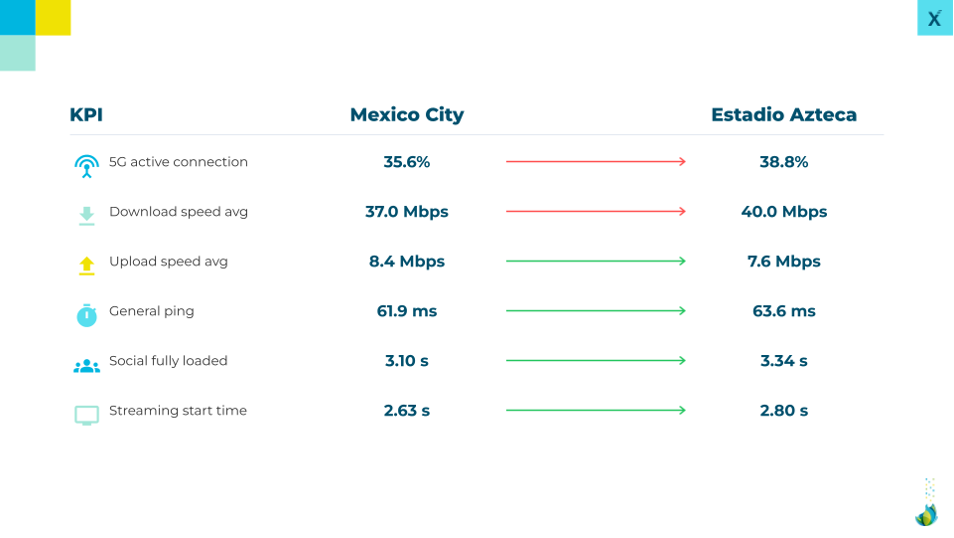
Mexico City and Estadio Azteca show a relatively aligned profile.
The stadium area does not show a major drop in access technology or Download speed. In fact, the observed 5G active-connection share is slightly higher around Estadio Azteca than in the broader Mexico City baseline: 38.8% around the stadium area versus 35.6% at city level. Average Download speed also moves slightly upward, from 37.0 Mbps in the city to 40.0 Mbps around the venue area.
That is a positive sign for a venue with such high symbolic importance.
However, some experience indicators move in the opposite direction. Upload speed is slightly lower around the stadium area, moving from 8.4 Mbps to 7.6 Mbps. Social media fully loaded time increases from 3.10 seconds to 3.34 seconds. Streaming start time also rises from 2.63 seconds to 2.80 seconds.
For fans, those are meaningful indicators. Upload speed affects how quickly they can share videos and photos. Social loading affects the second-screen experience. Streaming start time affects how quickly highlights and clips begin.
For Estadio Azteca, the message is not that the baseline is weak. The message is that the most fan-visible services; social, upload and video start, should be closely monitored, especially because this venue will host the opening match.
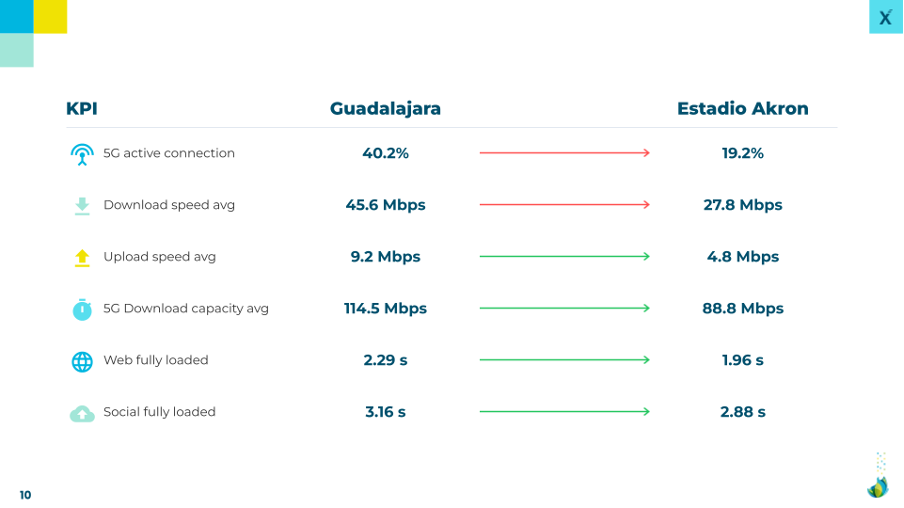
Guadalajara - Estadio Akron: the clearest venue-area watch point
The comparison between Guadalajara and Estadio Akron shows the most visible shift among Mexico’s three host locations.
At city level, Guadalajara shows an observed 5G active-connection share of around 40.2%. Around Estadio Akron, that falls to around 19.2%. The observed 4G share rises to around 75.0% around the stadium area.
Speed indicators also decrease. Average Download speed moves from 45.6 Mbps in Guadalajara to 27.8 Mbps around Estadio Akron. Average Upload speed falls from 9.2 Mbps to 4.8 Mbps. 5G Download speed also drops from 114.5 Mbps to 88.8 Mbps, while 5G Upload speed decreases from 12.9 Mbps to 7.5 Mbps.
This matters because the World Cup will be highly upload-driven. Fans will not only consume the event; they will create and share it. If Upload speed is constrained around the venue area, the friction will be visible in everyday actions: delayed videos, slower posts, media messages taking longer to send.
But the picture is not one-dimensional.
Estadio Akron performs better than Guadalajara’s city baseline in some loading indicators. Web fully loaded time improves from 2.29 seconds to 1.96 seconds, and social media fully loaded time improves from 3.16 seconds to 2.88 seconds.
That makes Estadio Akron a nuanced but important watch area. It shows better performance in some application-loading indicators, but weaker access technology and speed. For World Cup planning, that combination deserves close attention.
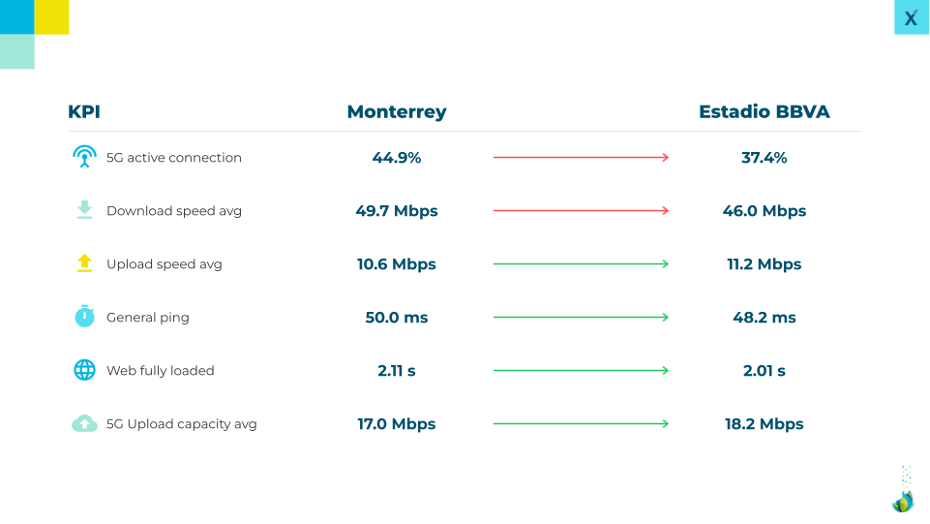
Monterrey - Estadio BBVA: the most stable city-to-stadium profile
Monterrey and Estadio BBVA show the most stable transition from city baseline to stadium area.
The observed 5G active-connection share decreases from 44.9% in Monterrey to 37.4% around Estadio BBVA. However, the broader experience profile remains relatively consistent.
Average Download speed moves from 49.7 Mbps to 46.0 Mbps, a moderate decrease. Average Upload speed improves slightly, from 10.6 Mbps to 11.2 Mbps. General ping also improves, from 50.0 ms at city level to 48.2 ms around the stadium area.
The 5G speed indicators are also relatively stable. Average 5G Download speed moves from 150.1 Mbps in Monterrey to 144.4 Mbps around Estadio BBVA, while 5G Upload speed improves from 17.0 Mbps to 18.2 Mbps.
This makes Estadio BBVA the most balanced Mexican venue-area profile in the dataset. It does not lead every metric, but it shows fewer visible degradations when compared with its host-city baseline.
For matchday readiness, that is an encouraging signal. The next challenge is whether this baseline can hold during moments of concentrated demand: stadium entry, halftime, goals, final whistle and post-match transport.
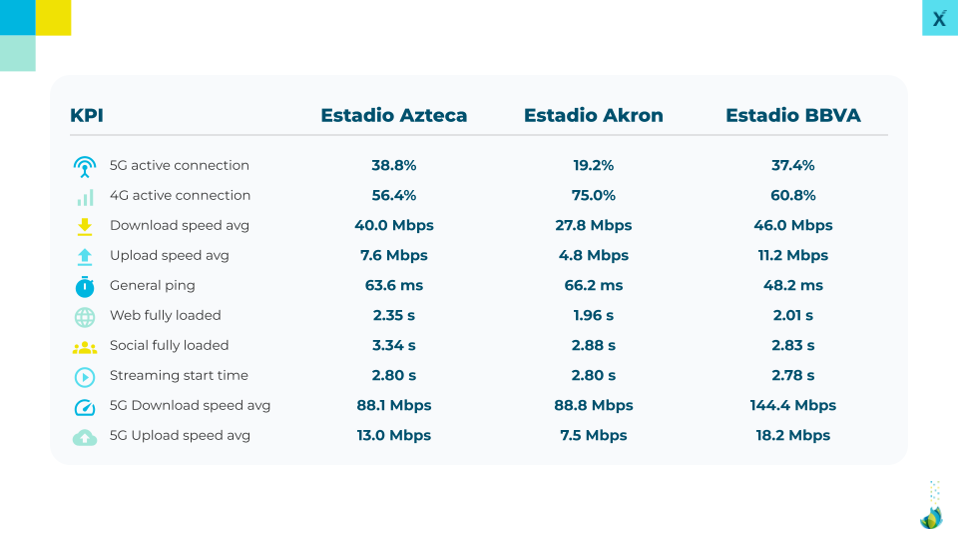
Comparing Mexico’s stadium areas: three different fan experience profiles
When looking only at the three Mexican stadium areas, the story becomes clearer.
Estadio BBVA shows the most balanced stadium-area profile. It has the strongest average Download speed and Upload speed among the three venues, the lowest general ping and the strongest 5G Upload speed. It also shows a relatively stable profile compared with Monterrey’s city baseline.
Estadio Azteca is broadly aligned with Mexico City and shows slightly higher 5G active connection and Download speed than the broader city baseline. However, because of its opening-match role, the key watch areas are social media loading, Upload speed and streaming start time.
Estadio Akron shows the clearest optimization opportunity. Its 5G active-connection share, Download speed and Upload speed are materially lower than Guadalajara’s city baseline. At the same time, web and social fully loaded times improve around the stadium, which reinforces the need to analyze multiple QoE dimensions rather than a single headline metric.
Key takeaways for operators, cities and event stakeholders
Mexico’s World Cup 2026 stadium connectivity story is not only about whether 5G is present. It is about whether the full digital fan journey can remain reliable when demand concentrates.
Five insights stand out.
1. Stadium areas can behave differently from their host cities.
Estadio BBVA remains relatively stable versus Monterrey, Estadio Azteca is broadly aligned with Mexico City, and Estadio Akron shows a more visible shift versus Guadalajara.
2. Upload speed should be treated as a strategic KPI.
Fans will generate massive amounts of content. Estadio BBVA shows the strongest Upload speed profile among the Mexican venues, while Estadio Akron shows the clearest constraint.
3. Mexico’s stadium areas remain heavily 4G-dependent.
Observed 5G active-connection share remains below 40% across the three Mexican venue areas. This means the fan experience will depend not only on 5G expansion, but also on the consistency and capacity of 4G.
4. Estadio Azteca deserves special monitoring because of the opening match.
The baseline is not dramatically worse than Mexico City, but social media loading, Upload speed and streaming start time are key watch areas.
5. No single KPI explains fan experience.
Estadio Akron improves in web and social loading, but drops in 5G access and capacity. Estadio BBVA is more stable overall. Estadio Azteca is aligned with the city, but some fan-visible services need attention. This is exactly why QoE must be measured across services, not only through speed or coverage.
What should be monitored during the tournament?
This analysis provides a baseline, but the real test will happen during matchday peaks: before kick-off, when fans arrive and open digital tickets; during queues and access control; at halftime; after goals and key moments; immediately after the final whistle; and across post-match transport corridors, fan zones and nearby entertainment districts.
For Mexico, the priority should be to monitor the full matchday experience around each venue, focusing on the indicators that most directly affect the fan journey: observed 4G/5G active-connection mix, Download and Upload speed, 5G speed, latency and jitter, social media loading, streaming start time, bitrate condition, web browsing and DNS lookup.
The baseline already shows why this granular view matters. Estadio BBVA presents the most stable city-to-stadium profile, Estadio Azteca remains broadly aligned with Mexico City but should be watched closely in social, upload and video start indicators, and Estadio Akron shows the clearest venue-area optimization opportunity, especially in 5G access and capacity.
The lesson is simple: city averages are useful, but the fan experience will be decided closer to the venue. The real question is not whether networks look ready on paper, but whether Mexico’s host cities and stadium areas can deliver a consistent digital experience when the world arrives.
Want to understand how mobile experience changes from city level to stadium areas?
MedUX helps operators, regulators and public stakeholders measure real Quality of Experience across mobile networks, high-density areas and critical event locations — combining crowdsourced visibility, active testing and advanced QoE analytics.
Contact us to learn how MedUX can support World Cup readiness, event-area monitoring and network experience benchmarking.
Don’t forget to follow us on social media and subscribe to our newsletter to receive the latest updates and news.
Follow us on:


About MedUX
At MedUX, we provide tools that help telecommunications regulators ensure that operators comply with Quality of Experience (QoE) and Quality of Service (QoS) standards for fixed, mobile, and digital services—based on real end-user data and insights. MedUX delivers a comprehensive view of the state and quality of digital services, as well as how they are perceived by end users.
MedUX offers innovative solutions for the telecommunications industry to tackle new challenges, enabling our clients to assess the quality of services provided, empower users, and meet regulatory requirements. If you'd like to learn more about our solutions, feel free to contact us at hello@medux.com.
Explore the Latest from MedUX
Honduras Mobile Network Experience in Q1 2026: Performance and QoE by Operator
Honduras’ mobile experience in Q1 2026 reflects a market where competitive leadership depends strongly on the service being measured. Claro shows clear strength in speed, application loading and streaming startup, while Tigo stands out in latency-sensitive and responsiveness indicators.
…

Dominican Republic’s Mobile Network Experience in Q1 2026: 5G, Performance and QoE by Operator
Dominican Republic’s mobile experience in Q1 2026 reflects a market where network leadership depends strongly on the dimension being measured. Claro shows clear strength in speed and several service-level indicators, Altice stands out in general network responsiveness and upload performance,…

MedUX Presents its QoS and QoE Measurement Project with ARTCI at ITU Zambia
Objective measurement of Quality of Service and Quality of Experience is becoming a key tool for regulators seeking to improve connectivity, transparency, and network performance.
MedUX participated in the ITU Workshop on Telecommunication Quality of Service, Quality of Experience and…