The FIFA World Cup 2026™ will be one of the most connected sporting events ever staged in the United States. But the real connectivity story will not be told by national averages. It will be decided city by city, operator by operator, and stadium area by stadium area.
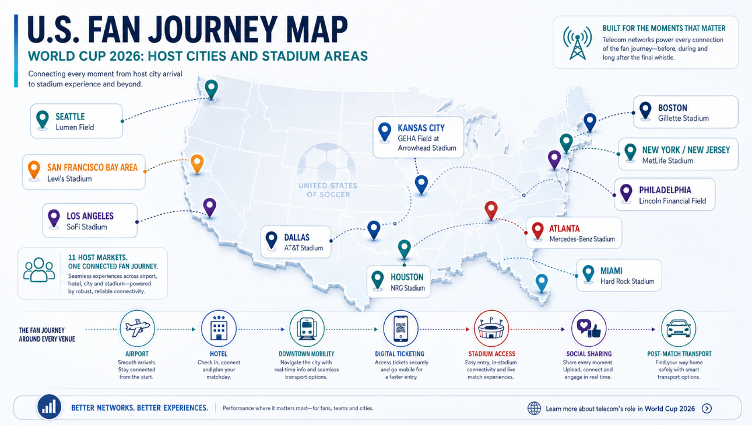
Across the 11 U.S. host markets — Atlanta, Boston, Dallas, Houston, Kansas City, Los Angeles, Miami, New York/New Jersey, Philadelphia, San Francisco Bay Area and Seattle — millions of fans will rely on mobile networks for almost every part of their journey: opening digital tickets, finding transport routes, sharing videos, loading social media, streaming highlights, coordinating with friends and staying informed in real time.
That makes mobile connectivity more than a technical layer. It becomes part of the fan experience itself.
But not every place will behave the same way.
Explore the full report and discover how U.S. host cities, operators and stadium areas compare in mobile Quality of Experience ahead of the FIFA World Cup 2026™.
Download the full report
MedUX’s baseline analysis shows a strong U.S. mobile experience foundation, but also a highly diverse performance landscape. At city level, Boston leads the speed baseline with average Download speed of around 243.6 Mbps, while Dallas shows the highest observed 5G active-connection share, at around 98.0%. Miami stands out in application experience, with the shortest streaming start time, around 1.70 seconds, and one of the fastest social media fully loaded times, around 1.98 seconds. Houston and Philadelphia show particularly strong DNS performance, both around 27.2 ms.
The operator-level view adds another layer. In many cities, T-Mobile appears as the main speed driver, while Verizon often stands out in uplink, social media loading or latency-sensitive indicators, and AT&T shows several strong DNS and responsiveness signals. This matters because World Cup readiness cannot be explained by a single KPI. Download speed, Upload speed, latency, DNS, streaming start time and social media loading all shape the experience fans actually feel.
The stadium-area picture is even more revealing.
Several venues outperform their host-city baselines in Download speed. Levi’s Stadium rises sharply from around 133 Mbps in San Francisco to around 414 Mbps around the venue. Mercedes-Benz Stadium increases from around 179 Mbps in Atlanta to around 323 Mbps. NRG Stadium improves from around 179 Mbps in Houston to around 313 Mbps, while MetLife Stadium, the final venue area, improves from around 205 Mbps in New York to around 306 Mbps.
Upload speed may be one of the most important hidden KPIs of the tournament. Fans will not only consume the World Cup; they will upload it. Videos, photos, stories, voice notes, live reactions and short-form content will put pressure on the uplink layer during arrivals, goals, halftime and post-match celebrations. In this baseline, SoFi Stadium improves from around 27 Mbps in Los Angeles to around 40 Mbps around the stadium area. Lincoln Financial Field increases from around 26 Mbps to around 39 Mbps, Mercedes-Benz Stadium from around 22 Mbps to around 36 Mbps, and GEHA Field at Arrowhead Stadium from around 22 Mbps to around 31 Mbps.
However, the analysis also challenges one of the simplest assumptions in telecom marketing: more 5G access does not automatically mean better end-to-end Quality of Experience.
Gillette Stadium shows an extremely high observed 5G active-connection share, effectively around 100%, but average Download speed falls from around 244 Mbps in Boston to around 59 Mbps around the stadium area. Lumen Field also shows very strong 5G access, around 99.7%, and excellent DNS performance, around 15.0 ms, but Upload speed falls from around 25 Mbps in Seattle to around 19 Mbps, while streaming start time increases from around 1.95 seconds to around 2.73 seconds.
SoFi Stadium tells the opposite story. Its Download speed is lower than the Los Angeles city baseline, but several fan-facing indicators improve: Upload speed rises to around 40 Mbps, 5G Upload to around 44 Mbps, general ping improves to around 20.1 ms, gaming-related ping to around 19.6 ms, DNS lookup drops to around 9.5 ms, and streaming start time improves to around 1.42 seconds. In other words, if we only looked at Download speed, we would miss the real fan experience story.
That is the core message of this analysis: World Cup 2026 connectivity readiness is multidimensional. City averages are useful, but the fan experience will be decided closer to the venue — at stadium gates, queues, fan zones, transport nodes, surrounding streets and post-match mobility corridors. The question is not simply whether U.S. networks have strong 5G coverage.
The question is whether each host city and stadium area can deliver a consistent digital experience when the world arrives.
Key questions answered in this report
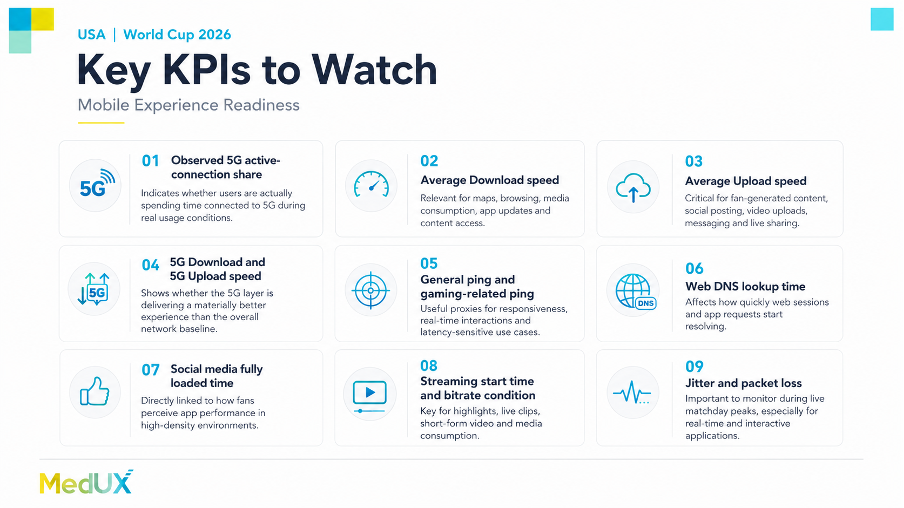
What KPIs best explain mobile experience readiness for major events?
Beyond Download speed, the analysis includes Upload speed, 5G active-connection share, 5G speed, latency, gaming-related ping, DNS lookup time, social media fully loaded time, streaming start time, jitter and packet loss.
Which U.S. World Cup 2026 host cities show the strongest mobile experience baseline?
The report compares the 11 U.S. host markets across speed, 5G access, latency, DNS performance, social media loading and streaming start time.
Which mobile operators lead in the most relevant fan experience KPIs?
The analysis looks at operator-level performance across cities, identifying where T-Mobile, Verizon and AT&T stand out depending on the KPI: speed, uplink, responsiveness, DNS or application experience.
Does high 5G access guarantee a better fan experience?
Not necessarily. The report shows that high observed 5G active-connection share is an important foundation, but it does not always translate into stronger Download speed, Upload speed or application-level performance.
Which stadium areas outperform their host-city baselines?
Several venues show clear improvements versus their city averages, especially in Download speed and Upload speed, revealing how stadium-area performance can differ from the broader urban baseline.
Why is Upload speed a critical World Cup 2026 KPI?
Because fans will not only download content; they will upload the tournament in real time through videos, photos, social posts, messages and live reactions.
Where does the city-to-stadium experience change the most?
The report highlights cases where stadium areas significantly outperform the city baseline, as well as cases where strong 5G access does not fully translate into better end-to-end Quality of Experience.
Want to understand how mobile experience changes from city level to stadium areas?
Explore the full report and discover how U.S. host cities, operators and stadium areas compare in mobile Quality of Experience ahead of the FIFA World Cup 2026™.
Download the full report
MedUX helps operators, regulators, cities and event stakeholders measure real Quality of Experience across mobile networks, high-density areas and critical event locations — combining crowdsourced visibility, active testing and advanced QoE analytics.
Want to know more?
Don’t forget to follow us on social media and subscribe to our newsletter to receive the latest updates and news.
Follow us on:
About MedUX
At MedUX, we provide tools that help telecommunications regulators ensure that operators comply with Quality of Experience (QoE) and Quality of Service (QoS) standards for fixed, mobile, and digital services—based on real end-user data and insights. MedUX delivers a comprehensive view of the state and quality of digital services, as well as how they are perceived by end users.
MedUX offers innovative solutions for the telecommunications industry to tackle new challenges, enabling our clients to assess the quality of services provided, empower users, and meet regulatory requirements. If you'd like to learn more about our solutions, feel free to contact us at hello@medux.com.